NCSD supplemental water misrepresentation
Please note: NCSD mixes up a lot of data and math, such as calendar years and water years and that has not been adjusted for in this overview.
Letter to the Editor:
NCSD supplemental water misrepresentation.
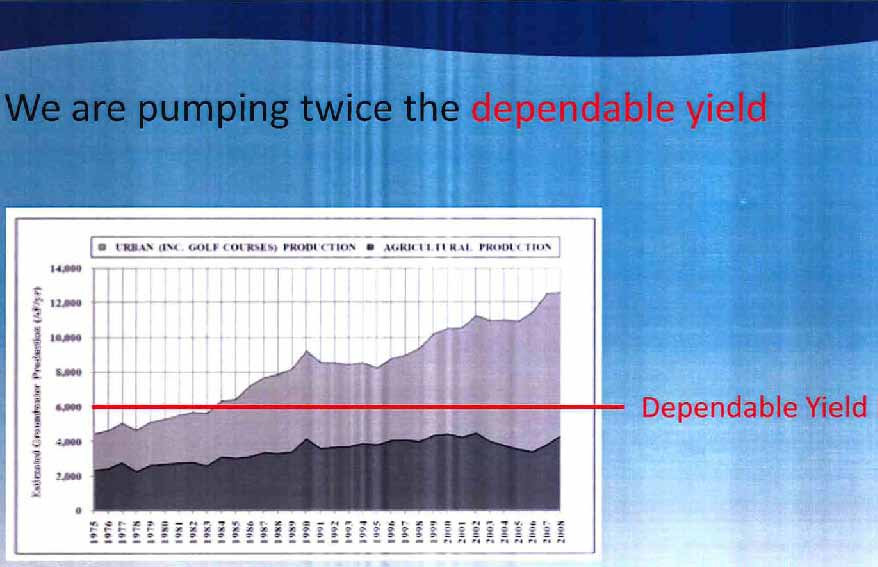
NCSD presentations on 8/23 and 11/9, claimed Nipomo is pumping twice the dependable yield (or supply).
NCSD claims “experts say” and present a “photoshopped” slide which shows a Production (pumping) vs Supply shortage for the last 27 years.
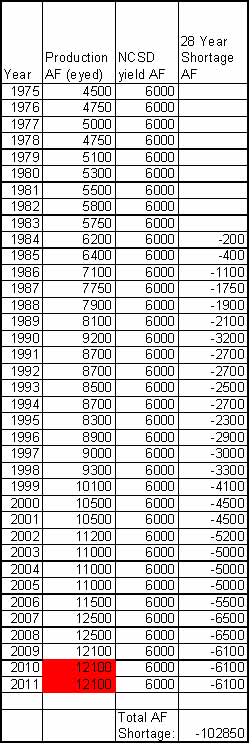
Add up the shortage for the 27 years and there should be about 100,000 AF less water underground.
Then they show a slide that has only the last 10 years of an "average water level".
It shows a decline. Which they claim is because of increased development.The real graph goes to 1975 and shows water in storage changing with changes in rainfall.
The water in storage does not show a100,000 AF drop expected from the “photoshopped” slide.
On top of that NCSD talks about the last two years being above average rainfall, but fail to mention that their rainfall numbers shows below average rainfall for the last 27 years. One would expect an even lower amount of water in storage from that.
In short the data does not show the alleged 100,000 AF shortage.
Look at the details for yourself before voting on www.NipomoWater.com.
Remember NCSD claims the WIP project can be built in less then two years.
Existing customers can all vote No now.When we are more certain a real problem is developing in the future, the pipeline can be built in time to prevent seawater intrusion.
Every year we wait we save millions of dollars.
John Snyder
NCSD supplemental water misrepresentation with graphs:
NCSD presentations on 8/23 and 11/9, claimed Nipomo is pumping twice the dependable yield (or supply):
NCSD presentation 8/23/11 Power Point slide #23 of Pumping Demand and "Dependable Yield" or "Supply" (1975-2008):
NCSD claims “experts say” and present a “photoshopped” slide which shows a Production (pumping) vs Supply shortage for the last 27years:
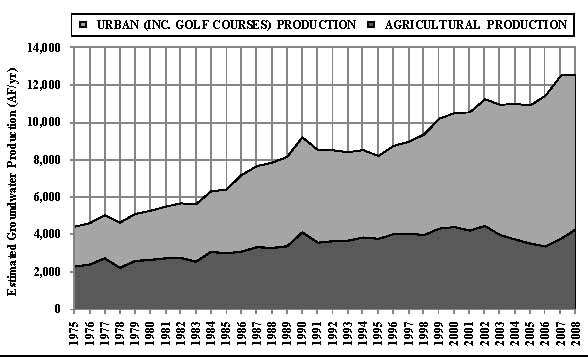
The chart from the NMMA TG was made into a slide that was "photo-shopped" to add a DWR "Dependable Yield" taken out of context:
The real source of "Pumping " data is the Nipomo Mesa Management Area Technical Group (NMMA TG) report, 2009 Page 39:
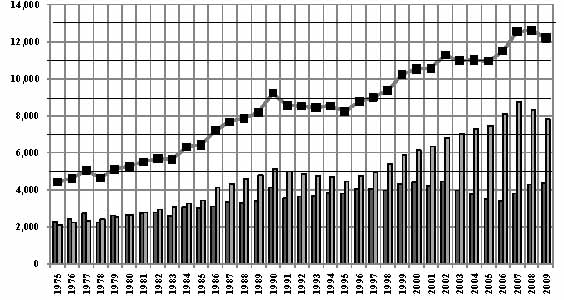
"Estimated Groundwater Production" was updated in the Nipomo Mesa Management Area Technical Group (NMMA TG) report, 2010 Page 32:
The photoshopped line is from:
Water Resources of The Arroyo Grande - Nipomo Mesa Area, Southern District Report, State of California The Resources Agency Department of Water Resources 2002 from page ES21:
For this study, estimates of dependable yield for each division of the main groundwater basin were determined from the hydrologic equation for the 1984 through 1995 base period and for the 1975 through 1995 study period. Because subsurface flows to the ocean could be reduced and subsurface flows between portions of the basin increased or decreased, the dependable yield is given as a range. Thus, the dependable yield is estimated to range between 4,000 and 5,600 AF for the Tri-Cities Mesa - Arroyo Grande Plain portion of the basin, between 4,800 and 6,000 AF for the Nipomo Mesa portion of the basin, and between 11,100 and 13,000 AF for the Santa Maria Valley portion of the basin. These estimates of dependable yield for each portion of the main groundwater basin are more meaningful if they are considered as a unified whole because the estimates are directly affected by the amounts and nature of the subsurface flows occurring between portions of the basin. Thus, the dependable yield for the main Santa Maria Basin within San Luis Obispo County ranges between 19,900 and 24,600 AF.
Water Resources of The Arroyo Grande - Nipomo Mesa Area, Southern District Report, State of California The Resources Agency Department of Water Resources 2002 from page 154:
Because subsurface flows to the ocean could be reduced and subsurface flows between the portions of the basin increased or decreased, the dependable yield values in Table 29 can be conservatively increased. Thus, the dependable yield for each portion of the main basin is given as a range.10 The dependable yield is estimated to range between 4,000 and 5,600 AF for the Tri- Cities Mesa - Arroyo Grande Plain portion of the basin, between 4,800 and 6,000 AF for the Nipomo Mesa portion of the basin, and between 11,100 and 13,000 AF for the Santa Maria Valley portion of the basin. These estimates of dependable yield for each portion of the main groundwater basin are more meaningful if they are considered as a unified whole because the estimates are directly affected by the amounts and nature of the subsurface flows occurring between portions of the basin. Thus, the dependable yield for the main Santa Maria Basin within San Luis Obispo County ranges between 19,900 and 24,600 AF.
During the course of this study, it became apparent that better data are needed to determine stream infiltration, deep percolation of precipitation, and groundwater extractions. Information is also needed that would assist in understanding the role of the Santa Maria River, Oceano, and Wilmar Avenue faults on subsurface flows. The resulting improvement in the estimated amounts of the items of water supply and use will, in turn, improve the estimates of dependable yield.
Add up the shortage for the 27 years and there should be about 100,000 AF less water underground:
The data from the real chart can then be used to add up the shortage from 1984 to 2011.
The data from the chart "Estimated Groundwater Production" was updated in the Nipomo Mesa Management Area Technical Group (NMMA TG) report, 2010 Page 32, but there is no source published for those numbers. The NMMA TG has meetings that the public cannot attend and the methods and source of its work cannot be acquired by the public record acts.
But a good estimate can be made by taking the chart and enlarging it estimating the "Production" for each year.
See Excel spread sheet:
Then they show a slide that has only the last 10 years of an "average water level". It shows a decline. Which they claim is because of increased development:
NCSD selective cut the data to make it look like there is a declining water table as a result of Urban use.
NCSD presentation 8/23/11 Power Point slide #16 of "Average" Water Levels (2000-2010):
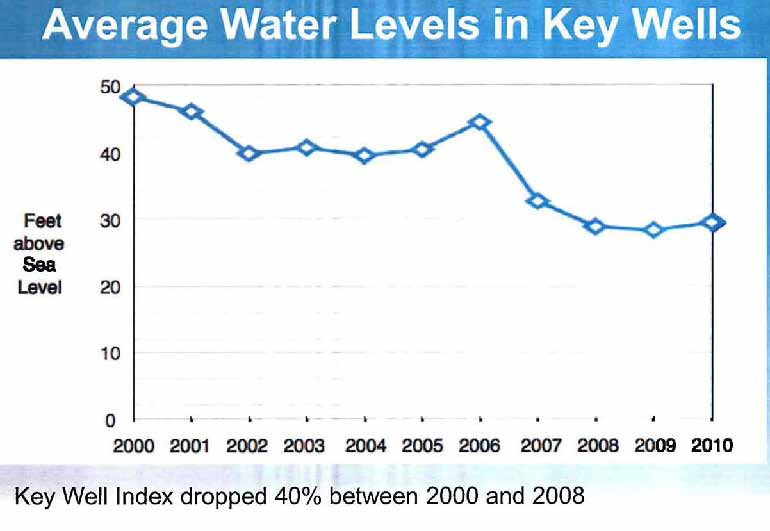
The real graph goes to 1975 and shows water in storage changing with changes in rainfall:
NCSD "Expert" Brad Newton Technical Memorandum Spring 2011 "Groundwater in Storage" ( now called "Groundwater Index")
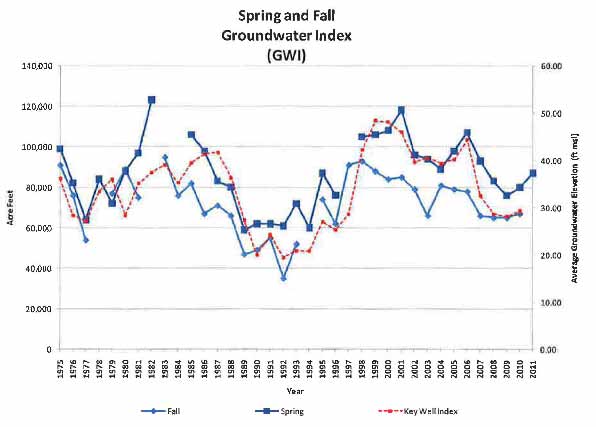
Note the red line for just the last 10 years is the source of the cut data for the NCSD slide on water levels
The chart of data (less values keywell index) for the above Graph are given:
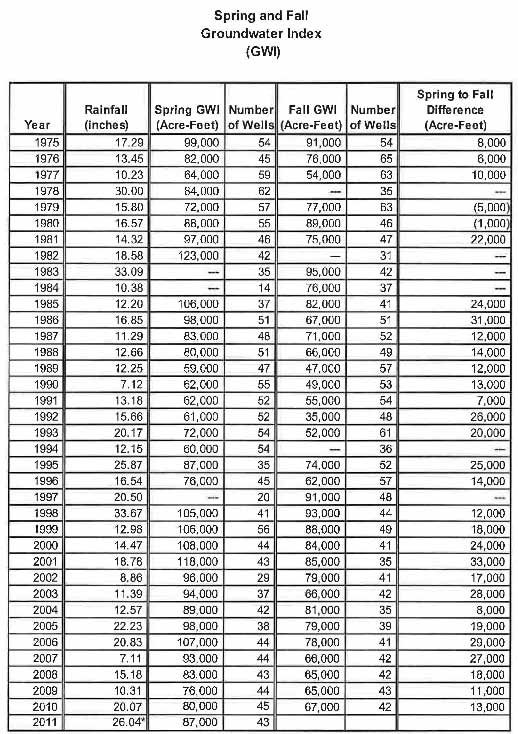
Now compare the Brad Newton data for Water in storage and the shortage that results from the NCSD Production vs Supply slide one can see that there is not a change in storage that matches the NCSD alleged Shortage:
The water in storage does not show a 100,000 AF drop expected from the “photoshopped” slide:
One should expect that the accumulated shortage shown in the Production vs Supply slide of 100,000 AF would result in a groundwater in storage that is 100,000 AF less than the start of the shortage in 1984.
1984 Fall level of 76,000 AF - 100,000 AF = - 24,000 AF
The 1984 spring level is missing, the 1985 level of 106,000 AF - 100,000 AF = 6,000 AF
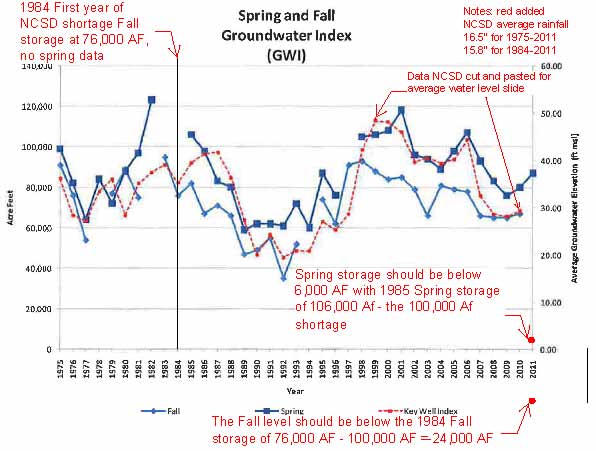
Clearly the water levels and water in storage are no where near what the NCSD alleged the shortage would require.
Water in storage is about the same given the below average rainfall of 15.8” out of a 16.5” average.
On top of that NCSD talks about the last two years being above average rainfall, but fail to mention that their rainfall numbers shows below average rainfall for the last 27 years. One would expect an even lower amount of water in storage from that:
Rainfall for the 28 years NCSD claims that there has been a shortage in supply is below the average using the Brad Newton data:
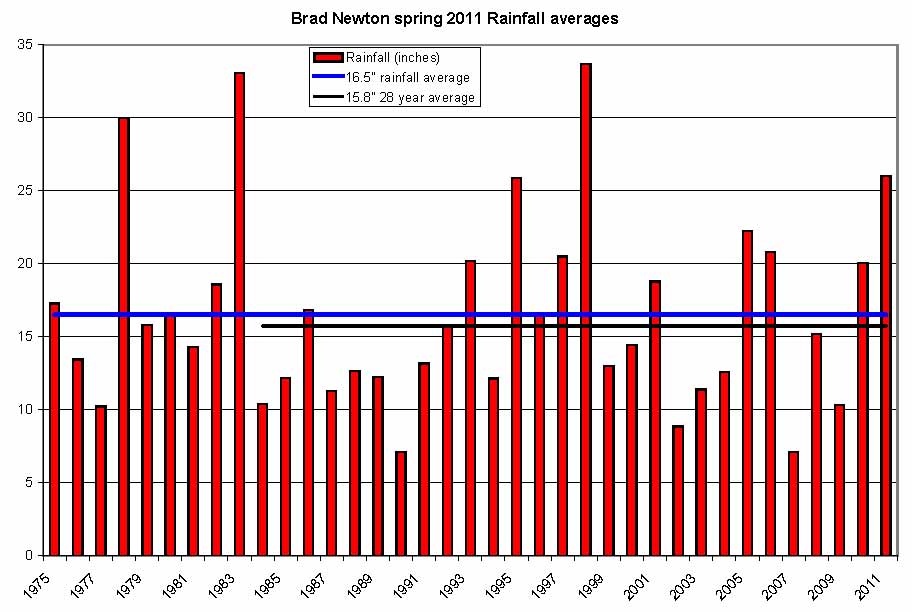
Rainfall has been below average for the years 1984 to 2011 so that should make the water in storage even lower then the 1984 minus 100,000 AF point.
So the water in storage should be below the shortage numbers for an average "supply" that NCSD used.
In short the data does not show the alleged 100,000 AF shortage.
Other related information:
The NMMA TG report covers the cross checking done by Experts:
Nipomo Mesa Management Area, 3rd Annual Report, Calendar Year 2010, Prepared by NMMA Technical Group, Submitted June 2011
Page 35, "The change in groundwater storage from the hydrologic inventory reflects the difference between inflow and outflow for a period of time. Typically, this change in storage is compared to a change in storage computed from groundwater contours, cross-checking the results of each. Storage changes from groundwater contours are typically calculated by measuring change in groundwater elevation and multiplying that change by a storage factor. The TG’s current understanding of confining conditions within the NMMA precludes calculating change in groundwater storage from groundwater contours at this time for the management area."
The 2002 DWR report covers the cross checking done by Experts:
Water Resources of The Arroyo Grande - Nipomo Mesa Area, Southern District Report, State of California The Resources Agency Department of Water Resources 2002
Page 147, "to ensure the validity of the estimates. To check the budgets, the water supply surplus/deficiency was summarized by year for the study period, 1975 through 1995. Thus, a cumulative surplus/deficiency for the 21 years was determined for each portion of the main groundwater basin. Because the surplus/deficiency value is actually the amount of change of groundwater in storage that takes place, the cumulative values were compared with the change in storage computed by the “specific yield method.”8 The comparison is a means of checking the probable amount of error in the budget (Peters, 1981)."
NCSD showed an edited Slide of water well levels (which relates to water in storage).
NCSD selective cut the data to make it look like there is a declining water table as a result of Urban use.
NCSD presentation 8/23/11 Power Point slide #16 of "Average" Water Levels (2000-2010):

NCSD presentation 11/9/11 Power Point slide #12 "average" water levels (2000-2011):

Both "Average Water levels in Key Wells" are taken out of context
The real source of the data is the Nipomo Mesa Management Area Technical Group (NMMA TG) report, 2010 Page 56:
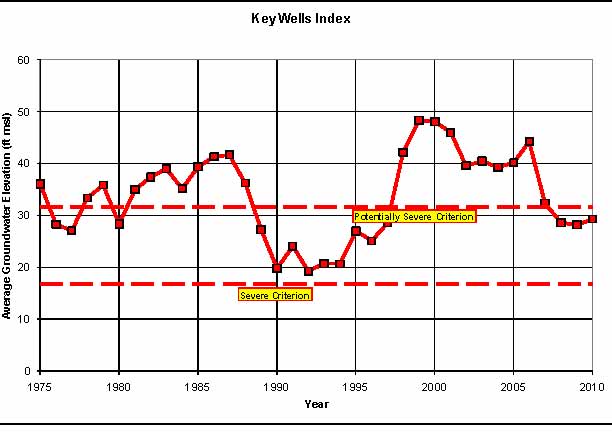
Which shows water levels going up and down with rainfall from 1975 to 2010.
Rainfall
NCSD presentation 8/23/11 Power Point slide #40 of Rainfall (1975-2007):
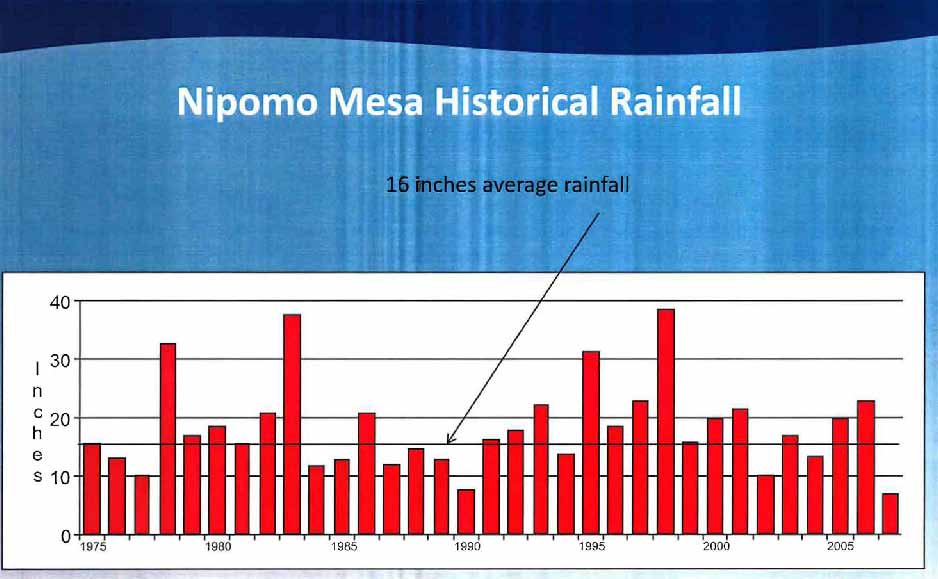
The presentation does not indicate where this data is from and ends in 2008.
(Not a complete list yet)
NCSD talks as if the numbers are well known and "experts say" but the
Nipomo Mesa Management Area Technical Group (NMMA TG) reports show almost all numbers are unknown.
___2011_0600_NMMA_TG_2010_Annual_Report.pdf_______________________________4.3__mb
Page ES-1, The TG reviewed these data and reports and concluded that the development of additional data and evaluations will be on-going to aid the understanding of the hydrogeologic conditions of the NMMA and to make comprehensive recommendations for the long-term management of the NMMA.
Page ES-1, "The TG recognizes that the data used in the evaluations are not equally reliable but represent what is currently available."
Page ES-1, "Such work is an important goal for the TG and mirrors the TG's desire to characterize groundwater storage in the NMMA."
Page ES-3, "13. There is a lack of understanding of the contribution of Los Berros and Nipomo Creeks to the NMMA water supplies (see Section 3.1.5 Streamflow).
Page ES-3, "14. There is a lack of understanding about confined and unconfined aquifer conditions in the NMMA, except near the coast and locally adjacent areas where the Deep Aquifer is known to be confined (see Section 2.3.2 Groundwater Flow Regime).
Page ES-3, "15. There is a lack of understanding of the flow path of rainfall, applied water, and treated wastewater to specific aquifers underlying the NMMA (see Section 3.1.10 Wastewater Discharge and Reuse)."
Page ES-5, "The inability to locate the monitoring well cluster under the sand dunes proximally north of Oso Flaco Lake renders the southwestern coastal portion of the NMMA without adequate coastal monitoring."
Page ES-5, "When a groundwater level is measured in a well, both the length of time since the measured well is shut off and the effect of nearby pumping wells modify the static water level in the well being measured."
Page ES-5, "It is recommended that all the wells used for monitoring have an accurate RP established over time."
Page ES-5, "Develop a methodology to potentially provide better estimates of subsurface flow across between the NMMA and NCMA."
Page ES-5, "Estimates of total groundwater production are based on a combination of measurements provided freely from some of the parties, and estimates based on land use."
Page ES-5, "To better estimate agricultural groundwater production where data is incomplete, it is recommended that the TG work with a subset of farmers to measure groundwater production."
Page ES-5, "Further defining the continuity of confining conditions within the NMMA remains a topic of investigation by the TG. The locations of unconfined conditions is important – they control to a significant degree both the NMMA groundwater budget as to the quantity of recharge from overlying sources and any calculation of changes in groundwater storage."
Page 3, "One of the sources of uncertainty is the subsurface quantity of groundwater that crosses the NMMA boundaries."
Page 11, "Along the coastal portion of the NMMA, it is not known if the principal aquifers are exposed on the seafloor."
Page 11, "These studies can be expected to provide additional information that can be used to improve the definition of faulting in the NMMA."
Page 11, "A significant aquitard exists in some areas near the base of the dune sand deposits that may confine groundwater in underlying aquifers."
Page 13, "The accuracy of the groundwater elevations depends on measurement protocols, the reference point and local drawdown effects at that well."
Page 15, "Quantifying the temporal and spatial variability is critical where rainfall is a large portion of the water supply."
Page 15, "Nipomo Creek streamflow is not currently gauged."
Page 16, "The most recent DWR Land Use survey that covers the NMMA was in 1996."
Page 17, "Where groundwater production records were unavailable, the groundwater production was estimated for calendar year 2010"
Page , ""
Page , ""
Page , ""
Page , ""
Page , ""
Page , ""
Page , ""
Page 5, "A manometer tube may not be high enough to measure the water level"
Page 21, "There exists missing data from both groundwater elevations and rainfall records. Estimations are made to fill in these data gaps with the understanding that the accuracy of these estimates is reduced."
Page 21, "Derivatives from these data therefore contain inaccuracies."
Page 21, "Additionally, precision issues arise when interpretations are made from data, in that individuals make decisions during the process of interpreting data that are subjective and therefore not documentable"
Page 21, "Estimations are made for parameters that are not measurable or very difficult to measure."
Page 21, "The methodologies used to make estimates represent a simplified numerical representation of the environment and are based on assumptions defining these simplifications."
Page 21, "Quantifying the uncertainty in data or data derivatives is a rigorous and ongoing process."
Groundwater Production:
Page 21, "The estimated production values are less reliable and precise for the rural residence groundwater production."
Page 21, "there is no measured data available in the NMMA to verify the precision or reliability of the agricultural production"
Groundwater In Storage:
Page 35, "The change in groundwater storage from the hydrologic inventory reflects the difference between inflow and outflow for a period of time. Typically, this change in storage is compared to a change in storage computed from groundwater contours, cross-checking the results of each. Storage changes from groundwater contours are typically calculated by measuring change in groundwater elevation and multiplying that change by a storage factor. The TG’s current understanding of confining conditions within the NMMA precludes calculating change in groundwater storage from groundwater contours at this time for the management area."
Page , ""
Response Plan Page 3, "Technical Group expects its understanding of NMMA characteristics will become increasingly more sophisticated and accurate. As a result of these considerations, the Technical Group acknowledges and expects that it will recommend modifications to the Severe and Potentially Severe Water Shortage Conditions criteria as more data are obtained on a consistent basis and as the Technical Group's understanding of the NMMA characteristics improves over time."
