
NCSD Half Truth #12: “water levels beneath the Nipomo Mesa have fallen significantly”
A two page PDF version that can be shared.
First attempt to make a spanish version.
NCSD often makes statements like:
We are using more water than is being replaced in our fresh water supply. Over the past decade, water levels beneath the Nipomo Mesa have fallen significantly.
July 2011 NCSD propaganda flyer: "The evidence is clear: We are using more water than is being replaced in our natural water supply. Over the past decade, water levels beneath the Nipomo Mesa have fallen significantly."
NCSD website FAQ: "Our fresh water aquifers are replenished by natural rainfall, but current demand
(even without additional urban development) is exceeding supply. Recent studies show that our community is actually using twice as much water today as is being replenished by rain. Safe pumping levels in the past allowed for aquifer replenishment. This is no longer the case. Today we are seeing an unmistakable drop in our fresh water supply."NCSD then implies that the 10 year decline is caused by "overpumping".
NCSD has used this false claim as a justification for existing customers paying for the Water Intertie Pipeline.
The decline in the water table is not tied to pumping it is tied to the wet/dry cycle of rainfall. The water levels are exactly where they should be for the amount of accumulated rain fall over the last 35 years based on the Nipomo Mesa Management Area Technical Group (NMMA TG) 2010 report charts of Key Well Index and CDF Cumulative Rainfall.
The NCSD's false claim that over pumping has caused a 10 year decline in water levels:
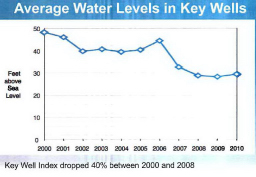
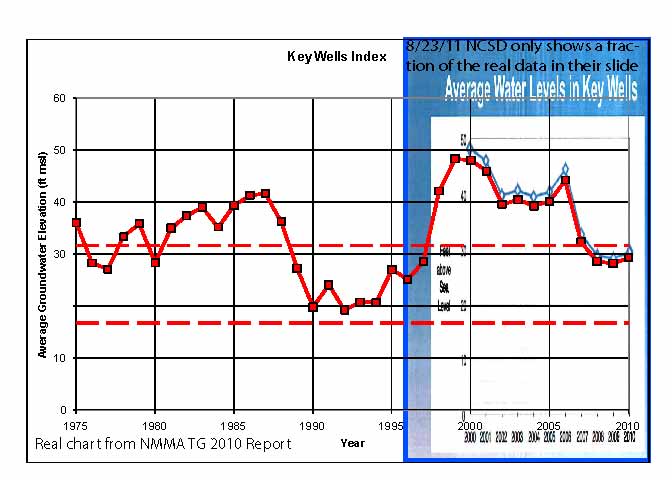
NCSD has shown a slide with a partial image that has only the last 10 years of an "average water levels in Key Wells".
See Left slide: NCSD presentation 8/23/11 Power Point slide #16 of "Average" Water Levels (2000-2010):
It shows a decline which they claim is because of increased pumping for urban development.
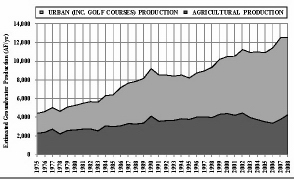
Then NCSD has shown a slide that has what they they claim is the pumping on the Nipomo Mesa which is based on the following slide:
See Right slide: The real source of "Pumping " data is the Nipomo Mesa Management Area Technical Group (NMMA TG) report, 2009 Page 39:
Then NCSD then incorrectly implies that the falling water table is caused by the increased pumping and because it is existing pumping by current customers they should pay for the majority of the supplemental water.
The NCSD mistakes:
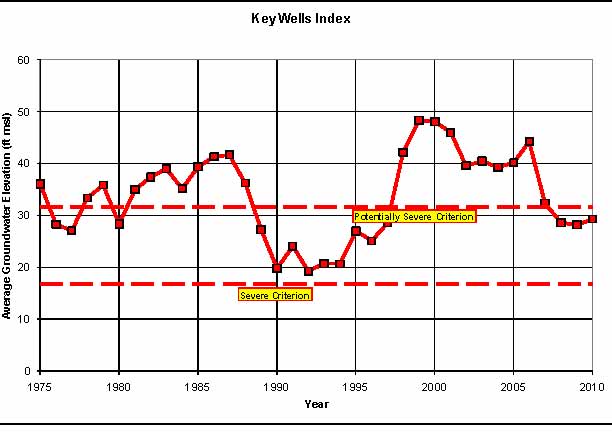
First NCSD has misrepresented the "average water levels in Key wells" by only showing the decline in the last 10 years. The 10 year period that starts with the highest amount accumulated above average rainfall and ends in a accumulated rainfall that is about average.
The whole chart shows the last 35 years of data with the normal rise and fall of the water table with rain fall.
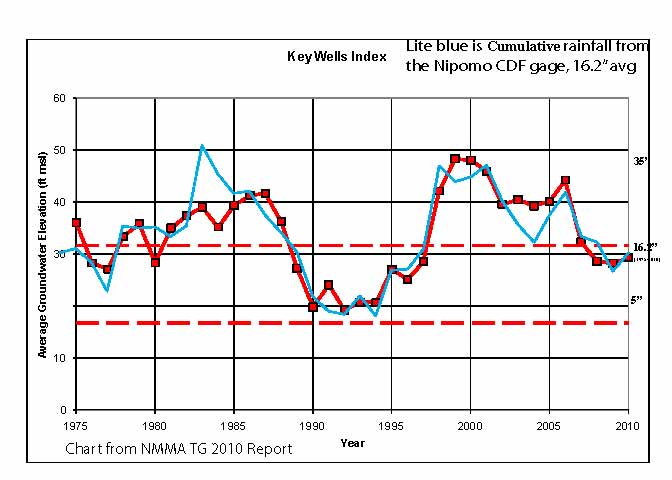
The real source of the data is the Nipomo Mesa Management Area Technical Group (NMMA TG) report, 2010 Page 56:
Here is NCSD's chart in blue behind the actual chart from the NMMA TG report.
NCSD has not produced a study that splits out the amount of "falling" in the water table being caused by the rainfall cycle vs the groundwater pumping.
The correct analysis of the data:
If correct study was done they would have to look at the relationship between the water table level and the accumulated amount of rainfall over the long term.
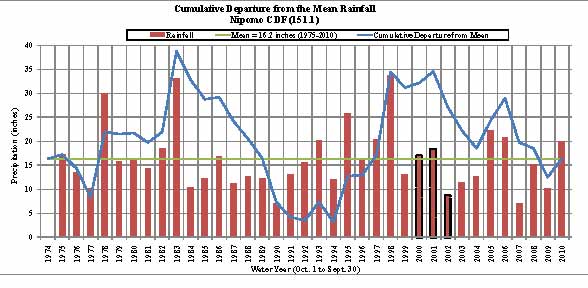
The proper rainfall data to compare the water level and rainfall relationship is measured as the cumulative departure from mean rainfall. Such as the 2010 NMMA TG report page 26, chart of Cumulative Departure from the Mean Rainfall Nipomo CDF (151.1). This is the California Fire Department (CDF) rain gage (151) located just north of the McDonalds at Tefft and 101.
The Cumulative number (the blue line) is just how much the cumulitave rainfall is above or below average so if in the first year the rainfall is 1" above average the cumulative number is 1" above average, if in the next year rainfall is 2" below average the line goes down -2" to -1". In the next year if there is 6" below average rainfall they the line goes down 6" to -7". In the next year rainfall is 14" above average the line goes up 14" to a cumulative value of 7" or to say it a different way over the four years the total rainfall above average by 7".
The next chart is just the 2010 NMMA TG report chart from page 56 with the key well index for the last 35 years and the 2010 NMMA TG report chart from page 26 of the California Fire Department (CDF) rain gage (151) blue line of the Cumulative Departure from Mean rainfall on top with the years lined up.
The water table is proportional to rain fall that has accumulated over the past 35 years. It does not show a decline because of over pumping. Given the nature of the measurements it is almost an exact match.
It's clear that the water table is exactly where it should be for the amount of rain we have had over the last 35 years.
The NCSD's claim of a 10 year fall in the water table is all a a result of the below average rainfall for the same 10 years.
NCSD's data matches the NMMA TG data:
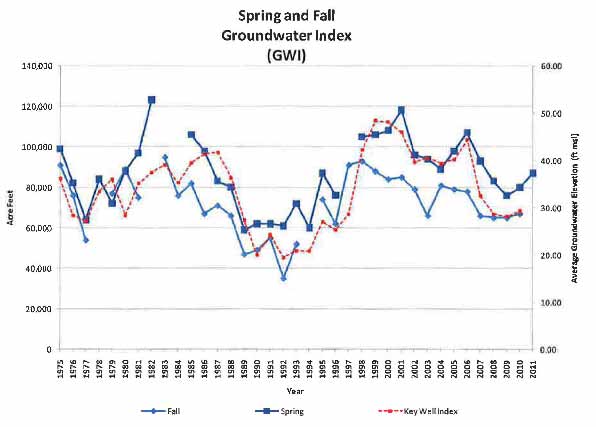
NCSD own data on water levels have the same trends as the Key Well Index from the NMMA TG:
NCSD "Expert" Brad Newton Technical Memorandum Spring 2011 "Groundwater in Storage" ( now called "Groundwater Index")
NCSD's uses incompatible data in a later slide:
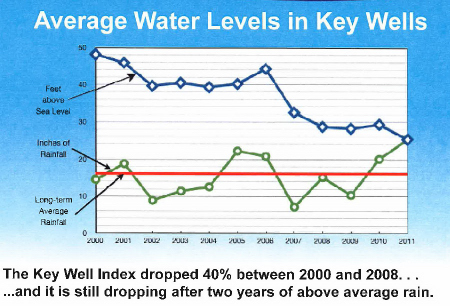
In a later presentation NCSD incorrectly used the a yearly rainfall graph instead of a cumulative rain fall graph to make it look like rainfall was more "average" then it actually was and imply the falling water levels were from pumping.
NCSD presentation 11/9/11 Power Point slide #12 "average" water levels (2000-2011):
Both "Average Water levels in Key Wells" and Rainfall are taken out of context from the real charts.
The real source of the data is the Nipomo Mesa Management Area Technical Group (NMMA TG) report, 2010 Page 56:
The yearly rainfall which NCSD used an average are taken out of context instead of using the full 35 year record for water levels and the 35 year cumulative rainfall.
Also please see NCSD supplemental water misrepresentation